 Hide Table of Contents
 Analysis
 Dynamic Layers
 Editing
 Feature Layers
 Feature Table
 Graphics
 Map
Map
 Mobile
 Online and Portal
 Popups and Info Windows
 Query and Select
 Renderers, Symbols, Visualization
 Search

Histogram Time Slider
Explore in the sandbox
Open in CodePen
View live sample
Description
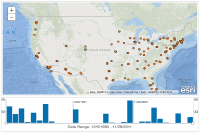
The histogram time slider widget provides a simple way to visualize temporal data and filter based on date. The data used in this sample is a feature service with points showing concerts played by U2 in the United States from 1980 - 2011.Code
<!DOCTYPE html>
<html>
  <head>
    <meta http-equiv="Content-Type" content="text/html; charset=utf-8">
    <meta name="viewport" content="initial-scale=1, maximum-scale=1, user-scalable=no">
    <title>Histogram Time Slider</title>
    <link rel="stylesheet" href="https://js.arcgis.com/3.46/dijit/themes/tundra/tundra.css">
    <link rel="stylesheet" href="https://js.arcgis.com/3.46/esri/css/esri.css">

    <style>
      html, body, #map {
        height: 100%; width: 100%; margin: 0; padding: 0;
      }
      #histogram-container text, #histogram-range,
      #scale-bar-left text, #scale-bar-right text {
        font-family: sans-serif;
      }
      #histogram-timeslider-dijit #focusTip {
        font-family: sans-serif;
      }
    </style>

    <script src="https://js.arcgis.com/3.46/"></script>
    <script>
      var map;

      require([
        "esri/map", "esri/InfoTemplate",
        "esri/layers/FeatureLayer", "esri/dijit/HistogramTimeSlider",
        "dojo/parser", "dojo/dom-construct",
        "dijit/layout/BorderContainer", "dijit/layout/ContentPane",
        "dojo/domReady!"
      ], function(
        Map, InfoTemplate,
        FeatureLayer, HistogramTimeSlider,
        parser, domConstruct
      ) {
          parser.parse();

          map = new Map("mapDiv", {
            basemap: "oceans",
            center: [-100, 40],
            zoom: 4
          });

          // feature service with U2 concerts from 1980 - 2011
          var featuresUrl = "https://services.arcgis.com/V6ZHFr6zdgNZuVG0/ArcGIS/rest/services/U2/FeatureServer/0";
          var layer = new FeatureLayer(featuresUrl, {
            id: "u2",
            infoTemplate: new InfoTemplate(
              "U2:  1980-2011", // keep title short
              "Date:  ${Date:DateFormat(selector: 'date', fullYear: true)}<br>" +
              "Venue:  ${Venue}, ${City}, ${State}<br>" +
              "Tour:  ${Tour}"
            ),
            // infoTemplate: new InfoTemplate("title", "description"),
            mode: FeatureLayer.MODE_SNAPSHOT, // SNAPSHOT required for the histogram time slider
            outFields: ["*"]
          });

          var layerUpdateEnd = layer.on("update-end", function() {
            layerUpdateEnd.remove();

            var sliderElem = domConstruct.create("div", {
              id: "timeSlider_"+ map.id,
              style: "margin-bottom:10px; bottom:33px"
            }, "bottom-div");
            var sliderParams = {
              // format the dates as mm/dd/yyyy
              // more formatting options:  https://developers.arcgis.com/javascript/3/jshelp/intro_formatinfowindow.html
              dateFormat: "DateFormat(selector: 'date', fullYear: true)",
              layers : [ layer ],
              mode: "show_all",
              timeInterval: "esriTimeUnitsYears"
            };
            var slider = new HistogramTimeSlider(sliderParams, sliderElem);
            map.setTimeSlider(slider);
            domConstruct.destroy("loading");
          });

          map.addLayer(layer);
        }
      );
    </script>
  </head>
  <body class="tundra">
    <div class="demoLayout" style="height: 100%; width: 100%"
         data-dojo-type="dijit/layout/BorderContainer"
         data-dojo-props="design: 'headline'">

        <div class="centerPanel"
             data-dojo-type="dijit/layout/ContentPane"
             data-dojo-props="region: 'center'">

          <div id="mapDiv"
            data-dojo-type="dijit/layout/ContentPane"
            data-dojo-props="region:'center'">
          </div>

        </div>

        <div class="edgePanel" id="bottom-div" style="height:145px; overflow:hidden"
             data-dojo-type="dijit/layout/ContentPane"
             data-dojo-props="region: 'bottom'">
        </div>

    </div>
  </body>
</html>