 Hide Table of Contents
 Analysis
 Dynamic Layers
 Editing
 Feature Layers
 Feature Table
 Graphics
 Map
Map
 Mobile
 Online and Portal
 Popups and Info Windows
 Query and Select
 Renderers, Symbols, Visualization
 Search

Display more data with FeatureLayer
Explore in the sandbox
Open in CodePen
View live sample
Description
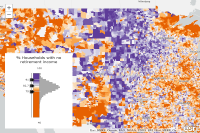
This sample demonstrates how to enable WebGL rendering on a FeatureLayer. WebGL allows you to display more features in the view and update the renderer of the layer more rapidly.Code
<!DOCTYPE html>
<html>
<head>
  <meta http-equiv="Content-Type" content="text/html; charset=utf-8">
  <meta name="viewport" content="initial-scale=1, maximum-scale=1,user-scalable=no">
  <title>Render FeatureLayer with WebGL</title>

  <link rel="stylesheet" href="https://js.arcgis.com/3.46/dijit/themes/claro/claro.css">
  <link rel="stylesheet" href="https://js.arcgis.com/3.46/esri/css/esri.css">

  <style>
    html, body, #mapDiv{
      padding:0;
      margin:0;
      height:100%;
      width: 100%;
    }
    #infoDiv {
      height: 320px;
      z-index: 2;
      padding: 10px;
      width: 250px;
      background-color: white;
      position: absolute;
      left: 20px;
      bottom: 20px;
      font-family: Verdana, Helvetica, sans-serif;
      font-size: 16px;
      color: #444;
      text-align: center;
    }
  </style>

  <script>
    // Enable WebGL on FeatureLayer for faster renderer updates and
    // display of more features in the map
    var dojoConfig = {
      has: {
        "esri-featurelayer-webgl": 1
      }
    }
  </script>

  <script src="https://js.arcgis.com/3.46/"></script>

  <script>
    require([
      "esri/map",
      "esri/urlUtils",
      "esri/arcgis/utils",
      "esri/dijit/ColorInfoSlider",
      "dojo/domReady!"
    ], function(
      Map,
      urlUtils,
      arcgisUtils,
      ColorInfoSlider
    ) {

      // if accessing webmap from a portal outside of ArcGIS Online, uncomment and replace path with portal URL
      // arcgisUtils.arcgisUrl = "https://pathto/portal/sharing/content/items";

      arcgisUtils.createMap("1962e91a17654bf7b6eddd6b009bc08b", "mapDiv").then(function (response) {

        var map = response.map;
        var zipCodeLayerId = map.graphicsLayerIds[0];
        var zipCodeLayer = map.getLayer(zipCodeLayerId);

        var renderer = zipCodeLayer.renderer;
        var authoringColorInfo = renderer.authoringInfo.visualVariables[0];
        var colorVisualVariable = renderer.visualVariables.filter(function(vv){
          return vv.type === authoringColorInfo.type;
        })[0];

        document.getElementById("title").innerHTML = colorVisualVariable.valueExpressionTitle;

        var sliderMin = 40;  // statistical min is 0, but 40 allows us to zoom to the histogram
        var sliderMax = authoringColorInfo.maxSliderValue

        zipCodeLayer
          .addPlugin("esri/plugins/FeatureLayerStatistics")
          .then(function(){
            zipCodeLayer
            .statisticsPlugin
            .getHistogram({
              valueExpression: colorVisualVariable.valueExpression,
              // querying with matching SQL expression gets histogram for full dataset
              sqlExpression: "( ACSNRETINC / (ACSNRETINC + ACSRETINC) ) * 100",
              sqlWhere: "ACSNRETINC + ACSRETINC > 0",  // avoid dividing by 0
              numBins: 30,
              minValue: sliderMin,
              maxValue: sliderMax
            })
            .then(function(histogram){

              var colorInfoSlider = new ColorInfoSlider({
                colorInfo: colorVisualVariable,
                minValue: sliderMin,
                maxValue: sliderMax,
                histogram: histogram,
                handles: [ 0,2,4 ],
                primaryHandle: 2
              }, "colorSliderElement");
              colorInfoSlider.startup();

              // reset renderer for each slider change
              colorInfoSlider.on("data-change", function(event){
                zipCodeLayer.renderer.setVisualVariables([event.colorInfo]);
                zipCodeLayer.redraw();
              });

            });
          });
      });

    });
  </script>
</head>

<body class="claro">
  <div id="mapDiv"></div>
  <div id="infoDiv">
      <span id="title"></span>
      <div id="colorSliderElement"></div>
  </div>
</body>

</html>