 Hide Table of Contents
 Analysis
 Dynamic Layers
 Editing
 Feature Layers
 Feature Table
 Graphics
 Map
Map
 Mobile
 Online and Portal
 Popups and Info Windows
 Query and Select
 Renderers, Symbols, Visualization
 Search

Using the attribute inspector
Explore in the sandbox
Open in CodePen
View live sample
Description
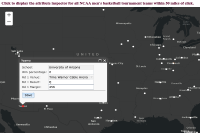
The Attribute Inspector is a widget that allows you to display and edit the selected features from one or more feature layers. If the data has subtypes or domains those are honored by the attribute inspector.
The attribute inspector provides the following:
- Performs validation
- Displays coded-value domains in drop down lists
- Shows a date picker (calendar) for date values.
If you are using the attribute inspector outside of the editor widget you are responsible for applying the changes to your feature service. Modifying an attribute fires the attribute-change event which provides access to the updated feature, the name of the field that was edited and the new value. In this sample we store the changed value each time an attribute is updated.
Code
<!DOCTYPE html>
<html>
<head>
<meta http-equiv="Content-Type" content="text/html; charset=utf-8">

<meta name="viewport" content="initial-scale=1,maximum-scale=1,user-scalable=no">
<title>Editable FeatureLayer with Attribute Inspector</title>

<link rel="stylesheet" href="https://js.arcgis.com/3.46/dijit/themes/claro/claro.css">
<link rel="stylesheet" href="https://js.arcgis.com/3.46/esri/css/esri.css">
<style>
  html, body, #mapDiv{
    height: 100%;
    width: 100%;
    margin: 0;
    padding: 0;
    overflow: hidden;
  }
  #detailPane{
    padding: 6px;
    height:20px;
    color:#570026;
    font-size:12pt;
    font-weight:600;
    overflow: hidden;
  }
  .dj_ie .infowindow .window .top .right .user .content { position: relative; }
  .dj_ie .simpleInfoWindow .content {position: relative;}

  .esriAttributeInspector .atiLayerName {display:none;}
</style>

<script src="https://js.arcgis.com/3.46/"></script>
<script>
  var map, updateFeature;

  require([
    "esri/map",
    "esri/layers/FeatureLayer",
    "esri/dijit/AttributeInspector",

    "esri/symbols/SimpleLineSymbol",
    "esri/symbols/SimpleMarkerSymbol",
    "esri/Color",
    "esri/renderers/UniqueValueRenderer",

    "esri/config",

    "esri/tasks/query",
    "dojo/dom-construct",
    "dijit/form/Button",

    "dojo/domReady!"
  ], function(
    Map, FeatureLayer, AttributeInspector,
    SimpleLineSymbol, SimpleMarkerSymbol, Color, UniqueValueRenderer,
    esriConfig,
    Query, domConstruct, Button
  ) {
    map = new Map("mapDiv", {
      basemap: "dark-gray-vector",
      center: [-97.395, 37.537],
      zoom: 4
    });

    map.on("layers-add-result", initSelectToolbar);

    //Feature Layer representing 2015 men's NCAA basketball tournament teams
    var teamsFL = new FeatureLayer("https://services.arcgis.com/V6ZHFr6zdgNZuVG0/arcgis/rest/services/NCAA_Tourney_2015/FeatureServer/1", {
      outFields: ["University", "WINPER", "Rd_64_Venue", "Rd_64_Result", "Rd_64_Margin"]
    });

    var selectionSymbol = new SimpleMarkerSymbol(
        SimpleMarkerSymbol.STYLE_CIRCLE, 6,
        new SimpleLineSymbol(
            "solid",
            new Color([255,0,0,0.5]),
            4
        ),
        new Color("#ED3939")
    );

    var defaultSymbol = new SimpleMarkerSymbol(
        SimpleMarkerSymbol.STYLE_CIRCLE, 7,
        null,
        new Color([255,255,255])
    );
    teamsFL.setSelectionSymbol(selectionSymbol);

    //Symbolize features by W/L record
    var recordRenderer = new UniqueValueRenderer(defaultSymbol, "Rd_64_Result");
    recordRenderer.addValue("W", new SimpleMarkerSymbol(SimpleMarkerSymbol.STYLE_CIRCLE, 7, null, new Color([93,240,79])));
    recordRenderer.addValue("L", new SimpleMarkerSymbol(SimpleMarkerSymbol.STYLE_CIRCLE, 7, null, new Color([240,146,79])));
    teamsFL.setRenderer(recordRenderer);

    map.addLayers([teamsFL]);

    function initSelectToolbar(evt) {
      var teamsFL = evt.layers[0].layer;
      var selectQuery = new Query();

      map.on("click", function(evt) {
        selectQuery.geometry = evt.mapPoint;
        selectQuery.distance = 50;
        selectQuery.units = "miles"
        selectQuery.returnGeometry = true;
        teamsFL.selectFeatures(selectQuery, FeatureLayer.SELECTION_NEW, function(features) {
          if (features.length > 0) {
            //store the current feature
            updateFeature = features[0];
            map.infoWindow.setTitle(features[0].getLayer().name);
            map.infoWindow.show(evt.screenPoint, map.getInfoWindowAnchor(evt.screenPoint));
          }
          else {
            map.infoWindow.hide();
          }
        });
      });

      map.infoWindow.on("hide", function() {
        teamsFL.clearSelection();
      });

      var layerInfos = [
        {
          'featureLayer': teamsFL,
          'showAttachments': false,
          'isEditable': true,
          'fieldInfos': [
            {'fieldName': 'University', 'isEditable': false, 'label': 'School:'},
            {'fieldName': 'WINPER', 'isEditable': true, 'tooltip': 'Win percentage', 'label': 'Win percentage:'},
            {'fieldName': 'Rd_64_Venue', 'isEditable': false, 'label': 'Rd 1 Venue:'},
            {'fieldName': 'Rd_64_Result', 'isEditable': true, 'tooltip': 'First round result (W/L)', 'label': 'Rd 1 Result:'},
            {'fieldName': 'Rd_64_Margin', 'isEditable': true, 'tooltip': 'First round margin of victory/loss', 'label': 'Rd 1 Margin:'}
          ]
        }
      ];

      //Initialize Attribute Inspector
      var attInspector = new AttributeInspector({
        layerInfos: layerInfos
      }, domConstruct.create("div"));

      //add a save button next to the delete button
      var saveButton = new Button({ label: "Save", "class": "saveButton"},domConstruct.create("div"));
      domConstruct.place(saveButton.domNode, attInspector.deleteBtn.domNode, "after");

      saveButton.on("click", function() {
        updateFeature.getLayer().applyEdits(null, [updateFeature], null);
      });

      attInspector.on("attribute-change", function(evt) {
        //store the updates to apply when the save button is clicked
        updateFeature.attributes[evt.fieldName] = evt.fieldValue;
      });

      attInspector.on("next", function(evt) {
        updateFeature = evt.feature;
        console.log("Next " + updateFeature.attributes.OBJECTID);
      });

      attInspector.on("delete", function(evt) {
        evt.feature.getLayer().applyEdits(null, null, [evt.feature]);
        map.infoWindow.hide();
      });

      map.infoWindow.setContent(attInspector.domNode);
      map.infoWindow.resize(350, 240);
    }
  });
</script>
</head>

<body class="claro">
  <div id="detailPane">
    Click to display the attribute inspector for all NCAA men's basketball tournament teams within 50 miles of click.
  </div>
  <div id="mapDiv"></div>
</body>
</html>