 Hide Table of Contents
 Analysis
 Dynamic Layers
 Editing
 Feature Layers
 Feature Table
 Graphics
 Map
Map
 Mobile
 Online and Portal
 Popups and Info Windows
 Query and Select
 Renderers, Symbols, Visualization
 Search

Geoenrichment - Infographic
Explore in the sandbox
Open in CodePen
View live sample
Description
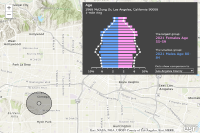
The Infographic widget requests for GeoEnrichment data of a given location, and visualizes the results in a Infographics consisting of properly formatted charts and/or tables. This sample allows users to click any location on the map and returns the GeoEnrichment data (an age pyramid) of a 1-mile ring buffer area.GeoEnrichmentis a subscription based service available through ArcGIS Online. Log-in credentials are always required when executing a GeoEnrichment task.
Code
<!DOCTYPE html>
<html>
  <head>
    <meta http-equiv="Content-Type" content="text/html; charset=utf-8">
    <meta name="viewport" content="initial-scale=1, maximum-scale=1, user-scalable=no">
    <title>Geoenrichment - Infographic</title>
    <link rel="stylesheet" href="https://js.arcgis.com/3.46/dijit/themes/claro/claro.css">
    <link rel="stylesheet" href="https://js.arcgis.com/3.46/esri/dijit/geoenrichment/themes/common/main.css">
    <link rel="stylesheet" href="https://js.arcgis.com/3.46/esri/css/esri.css">
    <style>
      html, body, #map {
        height: 100%;
        margin: 0;
      }
      #infographics {
        position: absolute;
        top: 10px;
        right: 10px;
      }
      #progressbar{
        position: absolute;
        bottom: 10px;
        left: 10px;
        width: 200px;
        display: none;
      }
    </style>
    <script src="https://js.arcgis.com/3.46/"></script>
    <script>
      require([
        "esri/map", "esri/graphic", "esri/symbols/SimpleMarkerSymbol", "esri/symbols/SimpleFillSymbol",
        "esri/dijit/geoenrichment/Infographic", "esri/tasks/geoenrichment/GeometryStudyArea", "dijit/ProgressBar", "dojo/domReady!"
      ], function(Map, Graphic, SimpleMarkerSymbol, SimpleFillSymbol, Infographic, GeometryStudyArea, ProgressBar){

        var map = new Map("map", {
          basemap: "topo-vector",
          center: [-118.25,34.06],
          zoom: 12
        });

        var infographics = new Infographic({
          type: "AgePyramid",
          variables: ["Age.*"],
          returnGeometry: true
        }, "infographics");

        var progressBar = new ProgressBar({
          indeterminate: true
        }, "progressbar");

        map.on("click", function(evt){
          map.graphics.clear();
          map.graphics.add(new Graphic(evt.mapPoint, new SimpleMarkerSymbol()));
          infographics.set("studyArea", new GeometryStudyArea({ geometry: evt.mapPoint }));
          infographics.startup();
          progressBar.domNode.style.display = "block";
        });

        infographics.on("data-ready", function(evt){
          map.graphics.add(new Graphic(evt.provider.getGeometry(), new SimpleFillSymbol()));
          progressBar.domNode.style.display = "none";
        });
      });
    </script>
  </head>
  <body class="claro">
    <div id="map"></div>
    <div id="infographics"></div>
    <div id="progressbar"></div>
  </body>
</html>