 Hide Table of Contents
 Analysis
 Dynamic Layers
 Editing
 Feature Layers
 Feature Table
 Graphics
 Map
Map
 Mobile
 Online and Portal
 Popups and Info Windows
 Query and Select
 Renderers, Symbols, Visualization
 Search

Geometry Service - Points for labeling
Explore in the sandbox
Open in CodePen
View live sample
Description
As an alternative to the label layer, you can create a label for one or more individual features by placing a text symbol at a given point. To do this, use the geometry service to generate a point for placing a label inside a polygon.
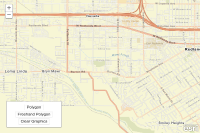
To try this sample, draw a polygon on the map. When you submit the polygon, it's simplified so it won't throw errors if it overlaps itself. The GeometryService.labelPoints() method determines a point inside the polygon. The parameters are an array of polygon graphics to be labeled and a callback function specifying what to do with the label points. In most cases, you'll be associating each point with a TextSymbol, like this:
labelPoints[i].setSymbol(textSymbol);
Code
<!DOCTYPE html>
<html>
  <head>
    <meta http-equiv="Content-Type" content="text/html; charset=utf-8">

    <meta name="viewport" content="initial-scale=1, maximum-scale=1, user-scalable=no">
    <title>Geometry Service: Label Points</title>

    <link rel="stylesheet" href="https://js.arcgis.com/3.46/dijit/themes/nihilo/nihilo.css">
    <link rel="stylesheet" href="https://js.arcgis.com/3.46/esri/css/esri.css">
    <style>
      html, body, #mapDiv {
        height: 100%;
        margin: 0;
        padding: 0;
        width: 100%;
      }
      #info {
        bottom: 20px;
        color: #444;
        height: auto;
        font-family: arial;
        left: 20px;
        margin: 5px;
        padding: 10px;
        position: absolute;
        width: 200px;
        z-index: 40;
      }
    </style>

    <script src="https://js.arcgis.com/3.46/"></script>
    <script>
      require(["dojo/dom",
      "dojo/dom-attr",
      "dojo/_base/array",
      "esri/Color",
      "dojo/number",
      "dojo/parser",
      "dijit/registry",

      "esri/config",
      "esri/map",
      "esri/graphic",
      "esri/tasks/GeometryService",
      "esri/tasks/BufferParameters",
      "esri/toolbars/draw",
      "esri/symbols/SimpleMarkerSymbol",
      "esri/symbols/SimpleLineSymbol",
      "esri/symbols/SimpleFillSymbol",
      "esri/symbols/Font",
      "esri/symbols/TextSymbol",

      "dijit/layout/BorderContainer",
      "dijit/layout/ContentPane"
  ], function(dom, domAttr, array, Color, number, parser, registry, esriConfig, Map, Graphic, GeometryService, BufferParameters, Draw,
              SimpleMarkerSymbol, SimpleLineSymbol, SimpleFillSymbol, Font, TextSymbol) {

    var map, toolbar, geometryService;

    parser.parse();

    // create the map control
    map = new Map("mapDiv", {
      basemap: "streets-vector",
      center: [-117.215, 34.05],
      zoom: 13,
      showAttribution: false
    });

    // create a toolbar for the map
    toolbar = new Draw(map);
    toolbar.on("draw-end", addToMap);

    // activate a drawing tool when a button is clicked
    registry.byId("polygon").on("click", function() {
      toolbar.activate(Draw.POLYGON);
      map.hideZoomSlider();
    });
    registry.byId("freehand").on("click", function() {
      toolbar.activate(Draw.FREEHAND_POLYGON);
      map.hideZoomSlider();
    });
    registry.byId("clear").on("click", function() {
      map.graphics.clear();
    });

    geometryService = new GeometryService("https://utility.arcgisonline.com/ArcGIS/rest/services/Geometry/GeometryServer");

    function addToMap(evtObj) {
      map.graphics.clear();
      var geometry = evtObj.geometry;
      // add the drawn graphic to the map
      var symbol = new SimpleFillSymbol(
        SimpleFillSymbol.STYLE_SOLID,
        new SimpleLineSymbol(SimpleLineSymbol.STYLE_SOLID, new Color([0, 0, 0]), 2),
        new Color([0, 0, 255, 0.5]));
      var graphic = new Graphic(geometry, symbol);
      map.graphics.add(graphic);

      // simplify polygon so it can be used in the get label points request
      geometryService.simplify([geometry], getLabelPoints);
    }

    function getLabelPoints(geometries) {
      if (geometries[0].rings.length > 0) {
        geometryService.labelPoints(geometries, function(labelPoints) { // callback
          toolbar.deactivate();
          map.showZoomSlider();

          var font = new Font("20px", Font.STYLE_NORMAL, Font.VARIANT_NORMAL, Font.WEIGHT_BOLDER);
          array.forEach(labelPoints, function(labelPoint) {
            // create a text symbol
            var textSymbol = new TextSymbol(
              "X: " + number.format(labelPoint.x) + ", Y: " + number.format(labelPoint.y),
              font, new Color([0, 0, 0]));

            var labelPointGraphic = new Graphic(labelPoint, textSymbol);

            // add the label point graphic to the map
            map.graphics.add(labelPointGraphic);
          });
        });
      } else {
        alert("Invalid Polygon - must have at least 3 points");
      }
    }
  });
  </script>

  </head>

  <body class="nihilo">
    <div id="mapDiv"></div>
    <div id="info" class="esriSimpleSlider">
      <button id="polygon" data-dojo-type="dijit.form.Button">Polygon</button>
      <button id="freehand" data-dojo-type="dijit.form.Button">Freehand Polygon</button>
      <button id="clear" data-dojo-type="dijit.form.Button">Clear Graphics</button>
    </div>
  </body>

</html>