 Hide Table of Contents
 Analysis
 Dynamic Layers
 Editing
 Feature Layers
 Feature Table
 Graphics
 Map
Map
 Mobile
 Online and Portal
 Popups and Info Windows
 Query and Select
 Renderers, Symbols, Visualization
 Search

Explore in the sandbox
Open in CodePen
View live sample
Description
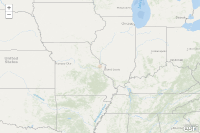
This sample demonstrates how to use the Geolocation API to add a graphic to the map document at the user's current location. As the location changes, the position of the graphic is moved to denote the new position. The sample also demonstrates how to use CSS animations to animate the graphic that is added to denote the users current location. Not all browsers support the capabilities demonstrated in this sample, visit caniuse.com to determine browser support for Geolocation and CSS Animations and Transitions.
In the snippet below, we check to see if browser supports geolocation, if it does we use the getCurrentPosition and watchPosition functions. The getCurrentPosition function retrieves the users current location and watchPosition tracks the users position as it changes. Both functions have the same structure, a success callback, error callback and a PositionOptions object. This snippet shows how to setup getCurrentPosition and watchPosition:
function initFunc(map){if(navigator.geolocation){
navigator.geolocation.getCurrentPosition(zoomToLocation, locationError);
navigator.geolocation.watchPosition(showLocation, locationError);
}
}
The success callback parameter has two properties coords and timestamp. Coords provides detailed information about the current location including latitude, longitude, speed, accuracy and altitude.
Users have to opt-in to geolocation. When viewing this application in a supported browser the user is asked if they want to allow geolocation. In the error callback, you can check the error code and determine if geolocation was allowed.
function locationError(error){switch(error.code){
case error.PERMISSION_DENIED: alert("Location not provided");
break;
case error.POSITION_UNAVAILABLE: alert("Current location not available");
break;
case error.TIMEOUT: alert("Timeout");
break;
default: alert("unknown error");
break;
}
}
In this sample we add a graphic to the map to mark the users current location. We can animate the graphic using CSS animations and transitions to apply a pulsing effect. In the example below the -webkit and -moz prefixes are used to define properties for the animation.
-webkit-animation-iteration-count: infinite;
-webkit-animation-name: pulse;
-moz-animation-duration: 3s;
-moz-animation-iteration-count: infinite;
-moz-animation-name: pulse;
To create the pulsing effect define a keyframe that defines what happens as the animation occurs, in this case the scale of the graphic is modified:
@-webkit-keyframes pulse{
0%{
opacity: 1.0;
-webkit-transform: scale(1.25);
}
45%{
opacity: .20;
-webkit-transform: scale(.80);
}
100%{
opacity: 1.0;
-webkit-transform: scale(1.25);
} }
Code
<!DOCTYPE html>
<html>
  <head>
    <meta http-equiv="Content-Type" content="text/html; charset=utf-8">
    <meta name="viewport" content="initial-scale=1.0, width=device-width, maximum-scale=1.0, user-scalable=no">

    <meta name="apple-mobile-web-app-capable" content="yes">
    <meta name="apple-mobile-web-app-status-bar-style" content="translucent-black">
    <meta http-equiv="Content-Type" content="text/html; charset=utf-8">
    <title>Geolocation API</title>

    <link rel="stylesheet" href="https://js.arcgis.com/3.46/esri/css/esri.css">

    <style>
      html, body {
        height: 100%;
        margin: 0px;
        padding: 0px;
        width: 100%;
      }

     @-webkit-keyframes
       pulse
      {
        0%
        {
          opacity: 1.0;

        }
        45%
        {
          opacity: .20;

        }
        100%
        {
          opacity: 1.0;

        }
      }
     @-moz-keyframes
       pulse
      {
        0%
        {
          opacity: 1.0;
        }
        45%
        {
          opacity: .20;

        }
        100%
        {
          opacity: 1.0;
        }
      }

      #map_graphics_layer {
        -webkit-animation-duration: 3s;
        -webkit-animation-iteration-count: infinite;
        -webkit-animation-name: pulse;
        -moz-animation-duration: 3s;
        -moz-animation-iteration-count: infinite;
        -moz-animation-name: pulse;
      }
    </style>

    <script src="https://js.arcgis.com/3.46compact/"> </script>
    <script>
      var map;
      var graphic;
      var currLocation;
      var watchId;
      require([
        "esri/map", "esri/geometry/Point",
        "esri/symbols/SimpleMarkerSymbol", "esri/symbols/SimpleLineSymbol",
        "esri/graphic", "esri/Color", "dojo/domReady!"
      ], function(
        Map, Point,
        SimpleMarkerSymbol, SimpleLineSymbol,
        Graphic, Color
      ) {
        map = new Map("map", {
          basemap: "oceans",
          center: [-85.957, 17.140],
          zoom: 2
        });
        map.on("load", initFunc);

        function orientationChanged() {
          if(map){
            map.reposition();
            map.resize();
          }
        }

        function initFunc(map) {
          if( navigator.geolocation ) {
            navigator.geolocation.getCurrentPosition(zoomToLocation, locationError);
            watchId = navigator.geolocation.watchPosition(showLocation, locationError);
          } else {
            alert("Browser doesn't support Geolocation. Visit http://caniuse.com to see browser support for the Geolocation API.");
          }
        }

        function locationError(error) {
          //error occurred so stop watchPosition
          if( navigator.geolocation ) {
            navigator.geolocation.clearWatch(watchId);
          }
          switch (error.code) {
            case error.PERMISSION_DENIED:
              alert("Location not provided");
              break;

            case error.POSITION_UNAVAILABLE:
              alert("Current location not available");
              break;

            case error.TIMEOUT:
              alert("Timeout");
              break;

            default:
              alert("unknown error");
              break;
          }
        }

        function zoomToLocation(location) {
          var pt = new Point(location.coords.longitude, location.coords.latitude);
          addGraphic(pt);
          map.centerAndZoom(pt, 12);
        }

        function showLocation(location) {
          //zoom to the users location and add a graphic
          var pt = new Point(location.coords.longitude, location.coords.latitude);
          if ( !graphic ) {
            addGraphic(pt);
          } else { // move the graphic if it already exists
            graphic.setGeometry(pt);
          }
          map.centerAt(pt);
        }

        function addGraphic(pt){
          var symbol = new SimpleMarkerSymbol(
            SimpleMarkerSymbol.STYLE_CIRCLE,
            12,
            new SimpleLineSymbol(
              SimpleLineSymbol.STYLE_SOLID,
              new Color([210, 105, 30, 0.5]),
              8
            ),
            new Color([210, 105, 30, 0.9])
          );
          graphic = new Graphic(pt, symbol);
          map.graphics.add(graphic);
        }
      });
    </script>
  </head>

  <body onorientationchange="orientationChanged();">
    <div id="map" style="width:100%; height:100%;"></div>
  </body>

</html>