 Hide Table of Contents
 Analysis
 Dynamic Layers
 Editing
 Feature Layers
 Feature Table
 Graphics
 Map
Map
 Mobile
 Online and Portal
 Popups and Info Windows
 Query and Select
 Renderers, Symbols, Visualization
 Search

Gauge
Explore in the sandbox
Open in CodePen
View live sample
Description
Version 3.0 of the ArcGIS API for JavaScript introduced the Gauge dijit. One of the goals in introducing this widget is to streamline the process of building dashboard-like apps.The object passed to the Gauge constructor can optionally include several parameters. It is recommended to supply as many of these as possible. If an app is using multiple gauges referencing the same feature layer, only one of the gauges should be created using the options.layer parameter.
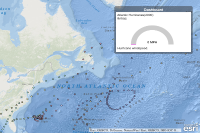
This sample shows how to use a single Gauge widget with a single feature layer.
Code
<!DOCTYPE html>
  <html>
  <head>
  <title>Gauge</title>
  <meta http-equiv="Content-Type" content="text/html; charset=utf-8">
  <meta name="viewport" content="initial-scale=1, maximum-scale=1,user-scalable=no">

  <link rel="stylesheet" href="https://js.arcgis.com/3.46/esri/css/esri.css">
  <style>
      html, body, #map { height: 100%; width: 100%; margin: 0; padding: 0; }
      #dashboard {
        background:rgba(56,56,56,.5);
        color: #fff;
        font-family: arial;
        height: auto;
        overflow: hidden;
        padding: 5px;
        position: absolute;
        right: 30px;
        text-align: center;
        top: 30px;
        width: 300px;
        z-index: 40;
        border-radius: 4px;
        border: 1px solid rgb(56,56,56);
      }
      #dashboardWidgets {
        background: #fff;
        color: #888;
        margin: 0 auto;
        text-align: left;
      }
  </style>

  <script>var dojoConfig = { parseOnLoad: true };</script>
  <script src="https://js.arcgis.com/3.46/"></script>
  <script>
    var map;

    require([
      "esri/map",
      "esri/layers/FeatureLayer",
      "esri/layers/GraphicsLayer",
      "esri/symbols/SimpleMarkerSymbol",
      "esri/graphic",
      "esri/dijit/Gauge",
      "dojo/domReady!"
      ], function (Map, FeatureLayer, GraphicsLayer, SimpleMarkerSymbol, Graphic, Gauge) {


      map = new Map("map",{
        basemap: "oceans",
        center: [-50.6, 46.1],
        zoom: 4,
        slider: false
      });

     var featuresUrl = "https://sampleserver6.arcgisonline.com/arcgis/rest/services/Hurricanes/MapServer/0";


      var fl = new FeatureLayer(featuresUrl, {
          "id": "hurricanes",
          "mode": FeatureLayer.MODE_ONDEMAND,
          "outFields": ["OBJECTID", "WINDSPEED", "DAY", "EVENTID"]
      });

      fl.on("load",createGauge);
      map.addLayer(fl);

      function createGauge(fl){
        // create JSON and pass it to the Gauge ctor
        var gaugeParams = {
          "caption": "Hurricane windspeed.",
          "color": "#c0c",
          "dataField": "WINDSPEED", // name of the attribute used for the gauge value
          "dataFormat": "value",
          "dataLabelField": "EVENTID",
          "layer": fl.layer,
          "maxDataValue": 120, // gauge max value, not used when dataFormat is "percentage"
          "noFeatureLabel": "No name",
          "title": "Atlantic Hurricanes(2000)",
          "unitLabel": " MPH"
        };

        var gauge = new Gauge(gaugeParams, "gaugeDiv");
        gauge.startup();

        //Set up mouse over highlighting
        var hGraphics = new GraphicsLayer({id:"highlights"});
        map.addLayer(hGraphics);

        var highlight = new SimpleMarkerSymbol().setColor(gaugeParams.color).setSize(12);

        fl.layer.on("mouse-over", function(e){
          hGraphics.clear();
          hGraphics.add(new Graphic(e.graphic.geometry, highlight));
        });
      }

    });
  </script>

  </head>

  <body>
    <div id="map">
       <div id="dashboard">
         <span style='text-align:center;'>Dashboard</span>
         <div id="dashboardWidgets">
            <div id="gaugeDiv"></div>
         </div>
       </div>
    </div>
  </body>
  </html>